
Topics covered in this article include:
- Introduction
- CT or Hounsfield Numbers
- Sensitometry Targets
- Linearity Plot
- Sensitometry Header Information
- Measured CT Numbers
- Contrast Scale
- Residual Plot
- Sensitometry Plot
- Effective Energy
- Mass Attenuation Coefficient Table
Introduction
Sensitometry information is given for the following Catphan® models: 500, 503, 504, 600, 604, 700.
CT or Hounsfield Numbers
Users of CT systems are often surprised when the CT number of a given tissue or substance is different from what they expect from previous experience. These differences do not usually indicate problems of a given CT scanner, but more likely arise from the fact that CT numbers are not universal. They vary depending on the particular energy, filtration, object size and calibration schemes used in a given scanner.
One of the problems is that we are all taught that the CT number is given by the equation: CT# = k(µ - µw)/µw, where k is the weighting constant (1000 is for Hounsfield Scale), µ is the linear attenuation coefficient of the substance of interest, and µw is the linear attenuation coefficient of water. Close review of the physics reveals that although the above equation is true to first order, it is not totally correct for a practical CT scanner. In practice, µ and µw are functions of energy, typical x-ray spectra are not monoenergetic but polychromatic, and a given spectrum emitted by the tube is “hardened” as it is transmitted (passes) through filter(s) and the object, finally reaching the detector. More accurately, µ=µ(E), a function of energy. Therefore: CT#(E) = k(µ(E) - µw(E))/µw(E)
Because the spectrum is polychromatic we can at best assign some “effective energy” Ê to the beam (typically some 50% to 60% of the peak kV or kVp). Additionally, the CT detector will have some energy dependence, and the scatter contribution (dependent on beam width and scanned object size, shape, and composition) may further complicate matters. Although the CT scanner has a built in calibration scheme that tries to correct for beam hardening and other factors, this is based on models and calibration phantoms that are usually round and uniformly filled with water, and will not generally match the body “habitus” (size, shape, etc.). The situation is really so complicated that it is remarkable that tissue CT numbers are in some first order ways “portable”!
In light of the above we can examine a parameter of CT performance, the “linearity scale”, as required by the FDA for CT manufacturer’s performance specifications. The linearity scale is the best fit relationship between the CT numbers and the corresponding µ values at the effective energy Ê of the x-ray beam. The effective energy Ê is determined by minimizing the residuals in a best-fit straight line relationship between CT numbers and the corresponding µ values.
In review, we will encounter considerable inter and intra scanner CT number variability. CT numbers can easily vary by 10 or more based on kVp, slice thickness, and object size, shape, and composition. There is some possibility of the use of iterative techniques and/or dual energy approaches that might lessen these effects, but certainly CT numbers are not strictly portable and vary according to the factors listed above.
Please note: The CT number measurements for the individual materials are the median of the measurements from the input slices.
Sensitometry Targets
CTP401 (Catphan® 500) contains: LDPE (low density polythylene), Acrylic, Teflon®, Air
CTP404 (Catphan® 503, 504, 600) contains: Polystyrene, LDPE, PMP (polymethylpentene), Air, Teflon®, Delrin®, Acrylic, and a vial for Water
CTP682 (Catphan® 605, 700) contains: Teflon®, Bone 50%, Delin®, Bone 20%, Acrylic, Polystyrene, LDPE, PMP, Lung Foam #7112, Air, and a vial for Water
CTP732 (Catphan® 604) contains: Teflon®, Bone 50%, Delin®, Bone 20%, Acrylic, Polystyrene, LDPE, PMP, and two Air targets.
The targets range from approximately +1000H to -1000H.
The monitoring of sensitometry target values over time can provide valuable information, indicating changes in scanner performance.
Nominal Material Formulation and Specific Gravity
| Material | Formula | Zeff1 | Specific Gravity2 |
HU Range3 Min : Max |
|---|---|---|---|---|
|
Air |
.78N, .21O, .01Ar | 8.00 | 0.00 | -1046 : -986 |
| Lung #7112 | [C38H38N8O15] | 6.64 | 0.19 | -925 : -810 |
| PMP | [C6H12(CH2)] | 5.44 | 0.83 | -220 : -172 |
| LDPE | [C2H4] | 5.44 | 0.92 | -121 : -87 |
| Water | [H2O] | 7.42 | 1.00 | -7 : 7 |
| Polystyrene | [C8H8] | 5.70 | 1.03 | -65 : -29 |
| Acrylic | [C5H8O2] | 6.47 | 1.18 | 92 : 137 |
| Bone 20% | .51C, .06Ca, .06H, .06N, .30O, .03P | 9.09 | 1.14 | 211 : 263 |
| Delrin® | Proprietary | 6.95 | 1.42 | 344 : 387 |
| Bone 50% | .35C, .14Ca, .04H, .06N, .34O, .06P | 11.46 | 1.40 | 667 : 783 |
| Teflon® | [CF2] | 8.43 | 2.16 | 941 : 1060 |
Electron Density and Relative Electron Density
| Material |
Electron Density (1023e/g) |
Electron Density (1023e/cm3) |
Relative Electron Density4 |
|---|---|---|---|
| Air | 3.002 | 0.004 | 0.001 |
| Lung #7112 | 3.144 | 0.588 | 0.176 |
| PMP | 3.435 | 2.851 | 0.853 |
| LDPE | 3.435 | 3.160 | 0.945 |
| Water | 3.343 | 3.343 | 1.000 |
| Polystyrene | 3.238 | 3.335 | 0.998 |
| Acrylic | 3.248 | 3.833 | 1.147 |
| Bone 20% | 3.178 | 3.623 | 1.084 |
| Delrin® | 3.209 | 4.557 | 1.363 |
| Bone 50% | 3.134 | 4.387 | 1.312 |
| Teflon® | 2.890 | 6.243 | 1.868 |
1Zeff, the effective atomic number, is calculated using a power law approximation.
2 For standard material sensitometry inserts, The Phantom Laboratory purchases a multiple year supply of each material in a single batch. Samples of the purchased material are then measured to determine the actual specific gravity. The specific gravity of air is taken to be .0013. For custom cast materials the specific gravity of each cast batch is noted and supplied with the phantom. The Lung #7112 is a foam, and while it is purchased in large batches, its density varies through the batch. For this reason the lung numbers may have a greater variation.
3 These are minimum and maximum measured values from a sample of 94 scans using different scanners and protocols. The Bone 20% limits are not taken from actual measurements but are scaled from measurements taken using an insert with a slightly different composition from an actual Catphan®700 Bone 20% insert. HU can vary dramatically between scanners and imaging protocols. Numbers outside this range are not unusual. Water was not measured so nominal values of +/- 7 HU are given.
4 Relative Electron Density is the electron density of the material in e/cm3 divided by the electron density of water (H2O) in e/cm3.
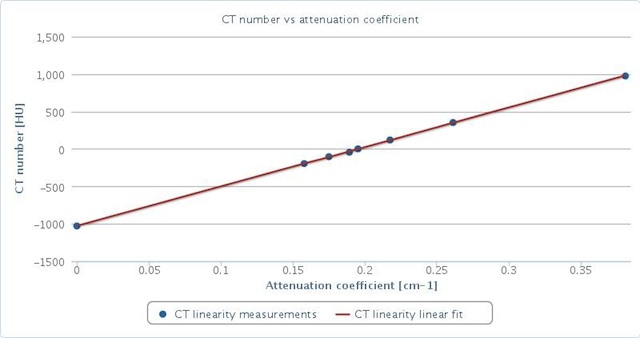
Linearity Plot
The CT linearity measurements come from a representative slice. The representative slice is the slice closest to the median of the estimated effective energy. The CT measurements from this representative slice are then used for the plotted points in the graph below. This plot is the optimal linear fit of measured CT numbers vs. attenuation coefficient from the linear attenuation coefficient table values.
The "Table Values" can be found in the linear attenuation coefficient table in the Sensitometry Physics Help section.
Sensitometry Header Information
The data displayed from the DICOM header is information significant to sensitometry analysis.
Measured CT Numbers
The CT number measurements for the individual materials are from the representative slice closest to the median of the estimated effective energy. Approximate expected CT numbers for each target material can be found in the linear attenuation coefficient table in the Sensitometry Physics Help Section.
Contrast Scale
The contrast scale is the calculated slope of the linearity plot.
Residual Plot
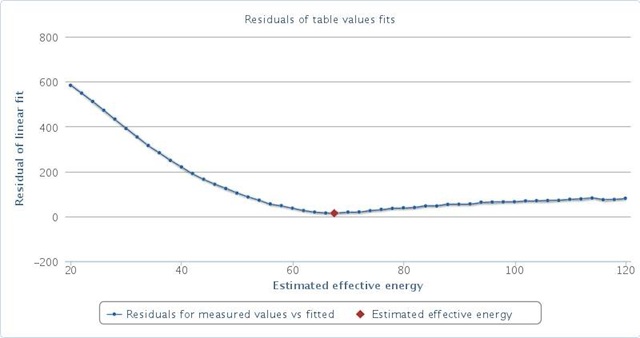
The residuals are calculated from linearity plots for each tabular energy value. The residuals are the distances of the measured values from the line in the linearity plot. From this residual plot the estimated effective energy is derived as the minimum point on the plot.
Sensitometry Plot
The sensitometry plot calculates the effective energy (keV) of the scan by plotting the measured CT number and the table values at each keV for the materials. The estimated effective energy value shown is obtained from the minimum residual from the linear fit of measured CT values vs. attenuation coefficient. The graph on the left displays the measured and table values for each material found. The graph on the right displays only the measured and table value of air.
The "Table Values" can be found in the linear attenuation coefficient table in the Sensitometry Physics Help section.
Effective Energy
The effective energy is obtained from the minimum point, or best fit, on the residual plot.
Mass Attenuation Coefficient Table
On the worksheet found at the link below are mass attenuation coefficients for sensitometry materials used in Catphan® phantoms.
Data is provided for selected energies from 20 keV to 20 MeV. Contributions from different interactions are given as well as totals both with and without coherent scattering effects. The values were obtained from the NIST XCOM database using our best knowledge of material compositions. The data is subject to change pending new information.